
The Goal: Drive maximum revenue during the critical Christmas trading period (Nov–Dec).
The Constraint: A “Code Red” timeline. I entered in November with zero lead-in time (no audience warming, no testing phase) and limited internal resource.
The Decision: The traditional “balanced marketing mix” (SEO + Email + Social) was abandoned. We didn’t have the runway for “slow-burn” channels to pay off. We needed a strategy built purely for speed.
Instead of trying to fix everything, we applied a Pareto (80/20) approach to the existing assets:
Asset Audit: We identified that Meta/Instagram had the fastest “Input-to-Revenue” feedback loop.
The “Harvesting” Pivot: We made the conscious decision to reduce seeding new audiences (Brand Awareness) and focus the budget on harvesting existing demand (Conversion) and increasing the value of current customers and orders (VoC and AOV).
Ruthless Prioritisation: We stripped away complexity. If an asset wasn’t a proven “High Winner,” it was cut. We doubled down on the middle and bottom funnel audiences and creatives that drove immediate ROI.
Risk Reduction: Top of funnel audiences were not forgotten, we still needed them to feed into the funnel for the year ahead. We just became more ruthless about where budget was spent and how we assessed the value of marketing spend.
With no time for broad brand awareness, efficiency was paramount. We moved away from generic targeting to a strict “Right Message, Right Person” protocol. From this we created clear groups to target with different messages and different revenue goals for each segment.

Audience Architecture: We rebuilt the ad account structure based segmented users not just by demographics, but by intent. This allowed us to separate “Cold” prospects from “Warm” past purchasers.
The “Journey” Logic: We engineered a specific journey based on their interests and their awareness of the product:
The Creative Match: We ensured that specific segments saw the creative most likely to resonate with their past behaviour (e.g., showing best-sellers to new audiences vs. specific bundles to returning customers).
The Conversion Layer: We used the urgency (delivery cut-off banners) only as the final “nudge” in the journey for high-intent users, rather than using it as a blunt tool for everyone.
The Outcome: This segmentation meant we weren’t wasting budget showing sales messages to people who didn’t know the brand yet, and we weren’t wasting brand stories on people who were ready to buy.
With paid media costs rising during Q4, simply acquiring customers wasn’t enough. We also saw an opportunity to improve the “Unit Economics” of every sale by increasing the Average Order Value (AOV).
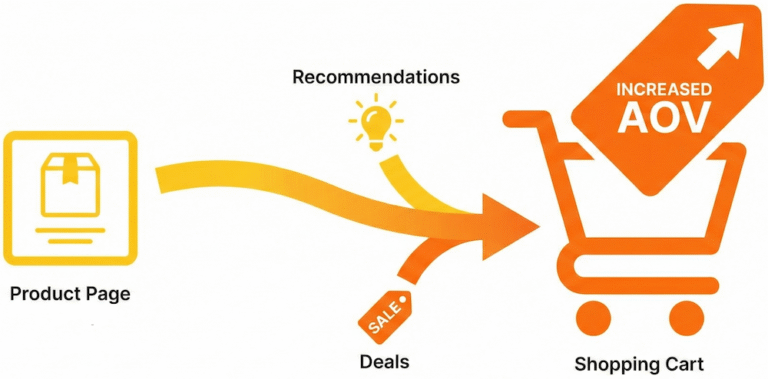
Behavioural Merchandising: By analysing user behaviour on-site, we adapted the product visibility to match user interest and intent—ensuring high-intent buyers were presented with higher-value bundles.
The “Impulse” Architecture: We optimised the checkout flow to capture incremental revenue. By implementing strategic “add-to-cart” prompts (relevant extras and complementary products) at the point of highest friction, we successfully increased the basket size without disrupting the purchase path.
The Result: This focus on AOV meant that for every £1 spent on ads, we weren’t just getting a customer; we were getting a higher-value customer, significantly improving the overall campaign ROAS (Return on Ad Spend).
As a niche brand we knew the fastest revenue earners before Christmas would be previous customers. There wasn´t the timeframe to create the same level of targeted journey as we had created with the ads. However, using the data from the previous year, there was plenty of opportunity to learn from previous campaigns to optimise the return from email campaigns.
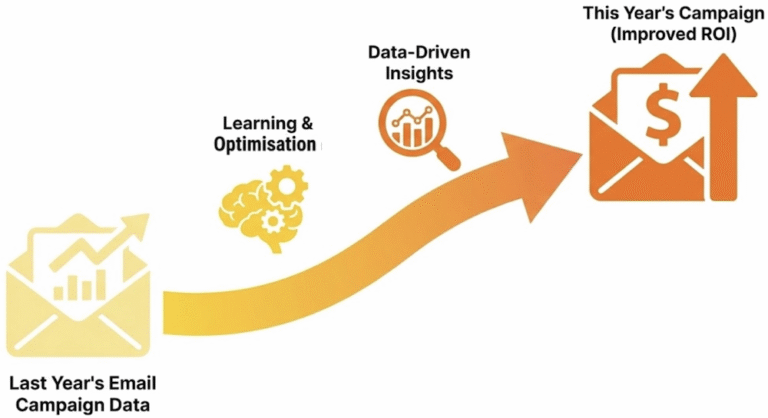
The Forensic Audit: We didn’t rely on guesswork. We conducted a deep-dive analysis of historical email performance, moving beyond vanity metrics (Open Rates) to focus on commercial indicators: Click-Through Rates (CTR), Conversion per Send, and AOV.
Commercial Calibration: By correlating past campaign themes with purchase data, we identified exactly what content drove revenue vs. what just drove noise.
ROI Maximisation: We applied these insights to the Winter campaign schedule, ensuring that every broadcast was calibrated for maximum ROI. We stripped out low-performing content types and doubled down on the offers and formats that data proved would drive high-value baskets.
This is where the short-term campaign delivered long-term value. By pushing the “Fast Channels” (Meta) to their limit, we exposed the critical gaps in the “Slow Channels” (Email):
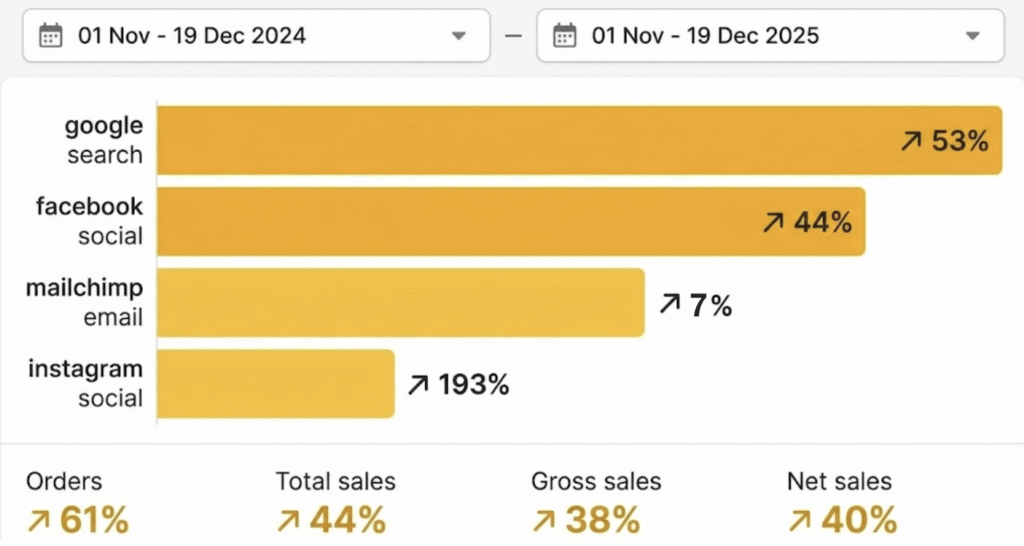
The Insight: Meta revenue grew +44%, but Email only grew +7%.
The Diagnosis: This “Stress Test” proved that the business was over-reliant on paid acquisition. The lack of automated Email Journeys meant we were “renting” customers rather than “owning” them.
The Q1 Blueprint: The campaign didn’t just make money; it provided the roadmap. We now know the potential value available by building the Email Automation Infrastructure that was missing in Q4.
The Results
Financials: +44% YoY Total Revenue (secured the cash flow).
Efficiency: +53% Organic Search lift (achieved via the “Halo Effect” of the paid strategy, proving we didn’t need expensive SEO work to get a short-term bump).
Strategic Legacy: The client transitioned from a generic “do everything” marketing plan to a data-backed Q1 roadmap focused on solving the specific retention gap we uncovered.
Ensuring Continual Growth
As part of the ruthless prioritising for ROI during winter months, we uncovered key aspects to improving both short and long term revenue increases. The company was equipped with:
ROI optimised groups and journeys within their ads profile, that they could continue to use and adapt.
Guidance on how to capitalise on the findings from the emails campaigns, and the further ROI potential available if they implement intent based journeys within their email campaigns.
Guidance on how to optimise for AI tools to support their long term online visibility.
Permanent AOV increase based on adjustments to product pages, recommendations and add to cart options.
I continue to work with this client on a consultative basis, as and when they need to optimise a marketing or sales channel.